Location: North Willow Glen, San Jose, Ca, USA
Altitude: 125 feet, Grid 37°18.544 , 121°54.521
Arduino based Weather Station
| Last Update | 3/13/26 12:12 AM |
|---|---|
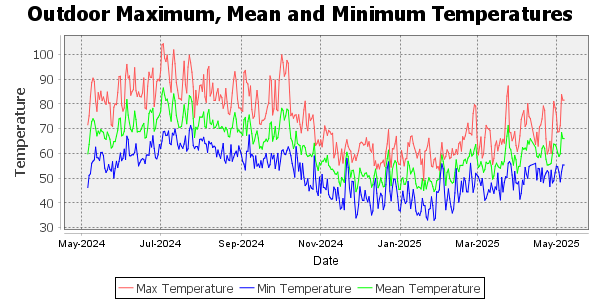
| Mean Temperature Yesterday | 62.1 °F |
| True Mean Temperature Yesterday | 61.3 °F |
| Mean Temperature last 7 days | 60.0 °F |
| Mean Temperature this month | 59.1 °F |
| Mean Temperature last 30 days | 56.4 °F |
| Mean Temperature last month | 54.6 °F |
| Mean Temperature last 60 days | 54.3 °F |
| Mean Temperature last 90 days | 53.4 °F |
| Maximum Temperature last 7 days | 77.2 °F at: 3/12/26 4:06 PM |
|---|---|
| Minimum Temperature last 7 days | 43.3 °F at: 3/11/26 7:41 AM |
| Maximum Temperature this month | 77.2 °F at: 3/12/26 4:06 PM |
| Minimum Temperature this month | 43.3 °F at: 3/11/26 7:41 AM |
| Maximum Temperature last 30 days | 80.0 °F at: 2/28/26 12:45 PM |
| Minimum Temperature last 30 days | 36.9 °F at: 2/21/26 1:32 AM |
| Maximum Temperature last month | 80.0 °F at: 2/28/26 12:45 PM |
| Minimum Temperature last month | 36.9 °F at: 2/21/26 1:32 AM |
| Maximum Temperature last 60 days | 80.0 °F at: 2/28/26 12:45 PM |
| Minimum Temperature last 60 days | 35.3 °F at: 1/13/26 7:40 AM |
| Maximum Temperature last 90 days | 80.0 °F at: 2/28/26 12:45 PM |
| Minimum Temperature last 90 days | 34.6 °F at: 1/10/26 7:30 AM |
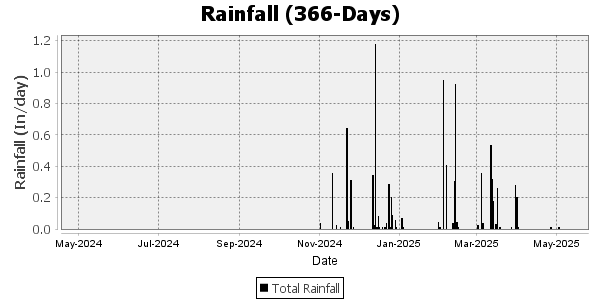
| Rainfall last 30 days | 2.68 In |
|---|---|
| Rainfall last 60 days | 2.76 In |
| Rainfall last 90 days | 5.64 In |
| Max one hour Rainfall at 2/16/26 8:00 AM | 0.19 In |
| Max 24 hr Rainfall at 2/16/26 9:00 PM | 1.29 In |
| Total Rainfall since 10/1/25 12:00 AM | 9.52 In |
| Total Rainfall last season¹ to date | 7.51 In |
| Total Rainfall entire last season¹ | 8.93 In |
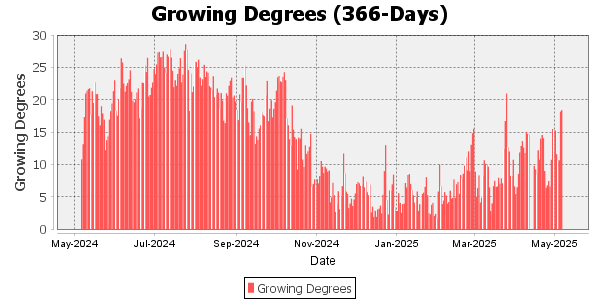
| Growing degree days measures the time each day spent in the ideal plant growth range² | |
|---|---|
| Growing degree days last 7 days | 85.8 °F |
| Growing degree days this month | 124.8 °F |
| Growing degree days last 30 days | 251.8 °F |
| Growing degree days last month | 234.8 °F |
| Growing degree days last 60 days | 462.2 °F |
| Growing degree days last 90 days | 611.4 °F |
| Growing degree days this season³ | 508.6 °F |
| Growing degree days last season³ to date | 451.4 °F |
| Growing degree days entire last season³ | 4490.7 °F |
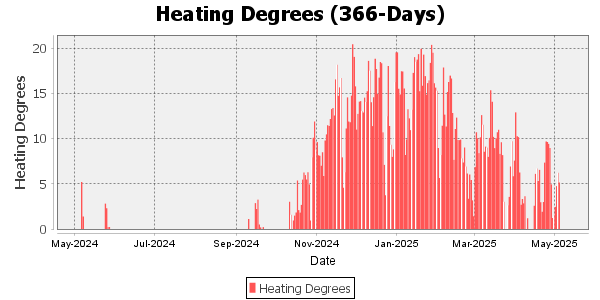
| Heating degree days estimates the heat required each day4 | |
|---|---|
| Heating degree days last 7 days | 44.5 °F |
| Heating degree days this month | 71.3 °F |
| Heating degree days last 30 days | 261.0 °F |
| Heating degree days last month | 330.1 °F |
| Heating degree days last 60 days | 646.5 °F |
| Heating degree days last 90 days | 1042.4 °F |
| Heating degree days this season5 | 1662.2 °F |
| Heating degree days last season5 to date | 1772.9 °F |
| Heating degree days entire last season5 | 2146.5 °F |
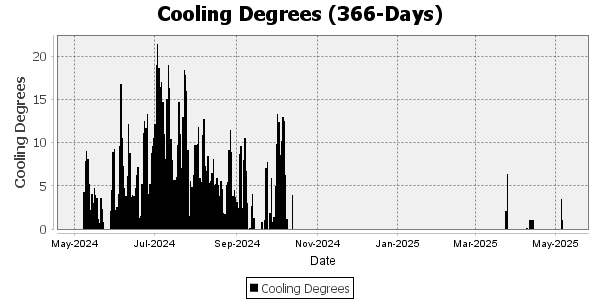
| Cooling degree days estimates the air conditioning required each day6 | |
|---|---|
| Cooling degree days last 30 days | 1.6 °F |
| Cooling degree days last month | 1.6 °F |
| Cooling degree days last 60 days | 1.6 °F |
| Cooling degree days last 90 days | 1.6 °F |
| Cooling degree days this season7 | 1.6 °F |
| Cooling degree days last season7 to date | 0.0 °F |
| Cooling degree days entire last season7 | 454.5 °F |
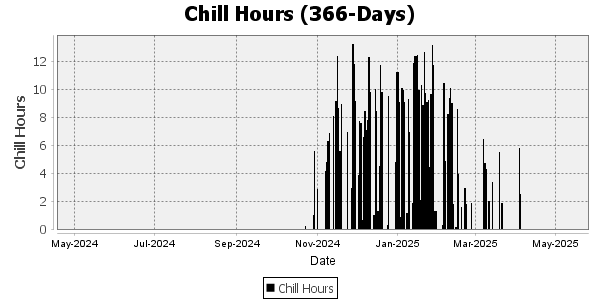
| Chill hours measures the time each day spent below 45 °F | |
|---|---|
| Chill hours yesterday | 0.00 hrs |
| Chill hours last 7 days | 2.29 hrs |
| Chill hours last 30 days | 50.61 hrs |
| Chill hours last 60 days | 211.87 hrs |
| Chill hours last 90 days | 338.94 hrs |
| Chill hours this season8 | 488.75 hrs |
| Days with chill hours this season8 | 67 days |
| Chill hours last season8 to date | 594.52 hrs |
| Days with chill hours last season8 to date | 87 days |
| Chill hours entire last season8 | 613.35 hrs |
| Days with chill hours entire last season8 | 92 days |